ASEAN-5 Capital Flow Shifting: From Surplus to Outflows Since 2020
- Jul 19, 2025
- 1 min read
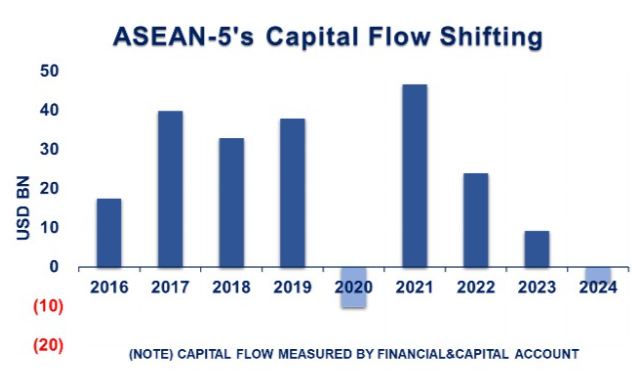
This bar chart shows the trend in capital and financial account balances for ASEAN-5 countries between 2016 and 2024.
Key Points:
2016–2019: Sustained capital inflows, averaging around USD 30–40 billion annually.
2020: Capital outflows triggered by COVID-19, marking the first net negative year.
2021: Strong rebound, reaching nearly USD 45 billion, but short-lived.
2022–2024: Steady decline, with 2024 expected to see near-zero or net capital outflows.
Implication:
This shift suggests rising investor caution, monetary tightening, and regional structural weaknesses. The once-reliable capital surplus of ASEAN-5 has eroded, underscoring the need for deeper capital market reforms and renewed investor confidence.


Comments